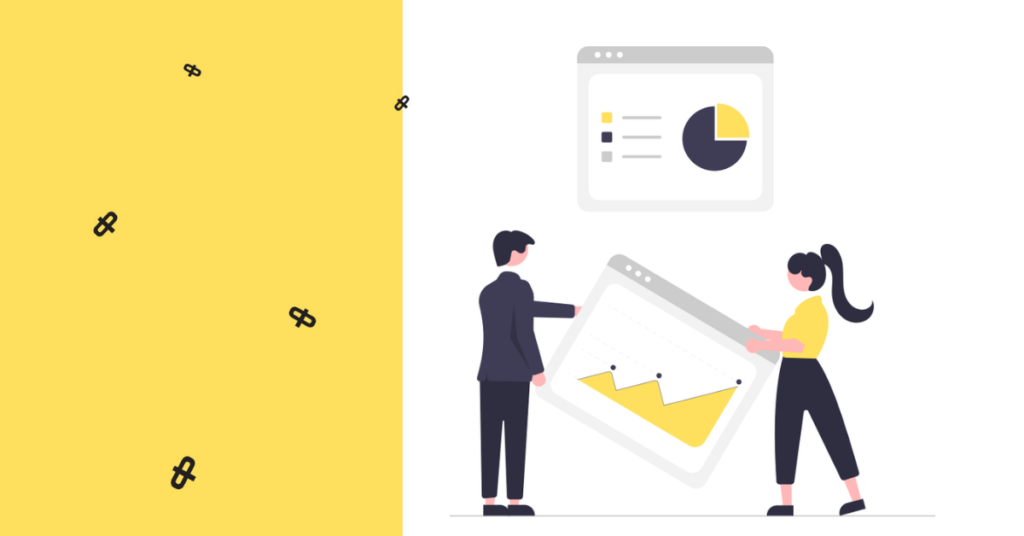
Stats are a powerful marketing tool, helping you get familiar with the industry trends and on top of the latest news. They make a great benchmark, too, and in turn, applying them to your strategy may result in an extra opportunity for businesses and more potential customers.
Are you looking for the best video marketing statistics? Do you want to know the best virtual events statistics in 2022? Are you interested in stats for an effective social media marketing strategy and social media posts? In this blog post, we gathered the best 2022 statistics for online marketers and each content creator.
SEO marketing statistics 2022
- 93% of online experiences start with search engines (Webfx)
- Video is 50 times more likely to get organic page ranks in Google than plain text results. (BrainShark)
- Quality on-page content is known to increase blog traffic by as much as 2,000%. (Marketing Sherpa)
- 95% of search traffic goes to the first page of search results (Webfx)
- 72% of marketers say that relevant content creation is the single most effective SEO tactic. (Marketing Profs)
- 43% of people click on a given result, solely based on the meta description. (Neil Patel)
- 70% of clicked search results are organic (Webfx)
- 78% of CMOs consider custom content to be the future of digital marketing. (Jeff Bullas)
- Content that lands on the first page of a Google search has an average of 1,890 words. (Backlinko)
- 68% of all clicks go to the first five positions in search results (Webfx)
- Blogs with images receive 94% more views than blogs without images. (Forbes)
- 40% of mobile website visitors will leave your site if it takes more than three seconds to load. (Google)
- 75% of search engine users don’t click past the first page (Webfx)
- 51% of searchers are more likely to purchase from a website that’s been optimized for mobile. (Blue Corona)
- 61% of mobile users are more likely to contact a local business with a mobile site. (BrightLocal)
- 14.6% of all SEO leads close (as opposed to 1.7% of outbound leads) (Webfx)
- 65% of survey respondents stated that they look for the most relevant content regardless of the company that provides the information. (Salesforce)
- Three in four smartphone owners turn to mobile search first to address their immediate needs. (Google)
- The average word count for first-page organic search results is 1,890 (Webfx)
- Google fields more than 2 trillion searches per year (Webfx)
- The average U.S. adult spent 3 hours and 35 minutes on their phones every day in 2018. (Emarketer)
- As page load time goes from one second to 10 seconds, the probability of the user bouncing is increased by 123%. (Neil Patel)
- 89% of marketers say SEO is successful (Webfx)
- 47% of polled consumers expect a page to load within two seconds. (Quicksprout)
- Conversion rates fall by 12% for every extra second that it takes your website to load. (Compass)
- 91% of pages on the Internet never get any organic traffic (Webfx)
- 44% of Fortune 500 company websites are not mobile-friendly. (Techcrunch)
- Enterprise brands named technical SEO as its most successful strategy. (SEO clarity)
- 59% of SEO specialists state that technical on-site optimization is the most effective SEO strategy used. (Medium)
- 36% of small-and medium-sized businesses (SMBs) have optimized sites (Webfx)
- 61% of consumers say they’re more likely to buy from mobile-optimized sites (Webfx)
- Page speed and indexation are the top technical concerns for SEO teams. (Medium)
- Usability experts claim that it should only take three clicks to find any given page. (SEJ)
- Local searches lead to more purchases than non-local searches. 18% of local searches on smartphones lead to a purchase within a day vs. 7% of non-local searches. (Google)
- 71% of B2B customers start their research with search engines (Webfx)
- 43% of consumers research products while in a store (Webfx)
- “Where to buy” and “near me” mobile queries have grown by over 200% in the past two years. (Think with Google)
- 60% of smartphone users have contacted a business directly using the search results such as the “click to call” option. (Think with Google)
- Over a two-year period, there was a 250%+ growth in mobile searches for “store open near me” (Think with Google)
- 46% of shoppers surveyed confirm inventory online before going to a store. (Think with Google)
- 70% of shoppers surveyed say the ability to shop in-person/ in a store is important when deciding which brand or retailer to buy from. (Think with Google)
- 50% of search engine users visit a store within a day of a local search (Webfx)
- 57% of B2B marketers stated that SEO generates more leads than any other marketing initiative. (HubSpot)
- Google has an 85.8% market share on search and 94.5% on mobile. (HubSpot)
- 80% of local searches convert (Webfx)
- 40% of marketers say algorithm changes are the biggest challenges to SEO (Webfx)
- 38% of marketers say budget constraints are the biggest challenges to SEO (Webfx)
- B2B customers are 57% of the way to buying before they perform an action on your site (Webfx)
- $497.16 is what the average U.S. business spends on SEO services each month (Webfx)
- 53% of businesses that spend more than $500 per month on SEO services rate themselves as “extremely satisfied” compared to businesses that spend less than $500 per month (Webfx)
- 60% of SMBs that use SEO also use PPC (Webfx)
PPC marketing statistics 2022
- $106.5 billion is the amount companies spent on search advertising globally in 2019. (Webfx)
- $9000 to $10,000 per month is the amount the average PPC campaign costs for small to mid-sized companies. (Webfx)
- Just under half of American citizens—46%, to be precise—pick up and unlock their smartphones to check for notifications upon waking up each and every morning. (Disruptiveadvertising)
- An astounding 86% of all American consumers regularly utilize the World Wide Web to search for local businesses that match their particular wants and needs. (Disruptiveadvertising)
- $2 for every $1 spent is how much businesses make on PPC. (Webfx)
- According to SocialMediaToday, more than 7 million advertisers invested a total of $10.1 billion in PPC ads just during 2017. (Disruptiveadvertising)
- The top 3 paid advertising spots get 46% of the clicks on the page. (Disruptiveadvertising)
- 80% of marketers now allocate at least some ad budget to search, social, display, and remarketing ads. (Webfx)
- Bing’s CPC increased 6% in 2018. (Disruptiveadvertising)
- 72% of companies haven’t looked at their ad campaigns in over a month. (Webfx)
- 65% of small to mid-sized businesses have a PPC campaign. (Webfx)
- 40% of brands and agencies say that their PPC budget is lower than where they actually want to be. (Disruptiveadvertising)
- 40% of brands want to increase their PPC budget, indicating that this is an effective and lucrative tool for marketers. (Disruptiveadvertising)
- 47% of the total global purchases are completed online. (Webfx)
- 39% is how much paid search accounted for in advertisers’ budgets. (Webfx)
- Mobile devices account for 53% of paid-search clicks (just one more reason to optimize your campaign for mobile advertisements). (Disruptiveadvertising)
- Facebook may have overestimated video viewing time over 79%.(Disruptiveadvertising)
- Facebook’s US Ad Revenues ($21.57 billion this year) will be twofold the amount spent on newspaper advertising ($10.74 billion). This will be close to the amount spent on entire print category ($23.12 billion). They even predict that the social media giant will move ahead of the print. (Disruptiveadvertising)
- 32% of companies use PPC to sell products directly to consumers. (Webfx)
- According to Formstack, PPC ads are one of the top three generators of on-page conversions. (Disruptiveadvertising)
- 65% of all clicks made by users who intend to make a purchase go to paid ads. (Disruptiveadvertising)
- $132 billion is how much search advertising spending is projected to grow worldwide by 2022. (Webfx)
- Instagram, LinkedIn and Pinterest will remain relatively easier to win on, in terms of spending to expand your online presence. (Disruptiveadvertising)
- 65% of advertisers say that programmatic has become an important PPC channel of digital ad industry over the last 12 months. (Disruptiveadvertising)
- 40% of in-store purchases begin online. (Disruptiveadvertising)
- $46 million is how much search ad spending accounts for in the U.S. in 2020. (Webfx)
- $6.75 is the highest average CPC for Google Ads, belonging to the legal industry. (Webfx)
- More than 40% of consumers use their smartphones to conduct research while inside a brick-and-mortar store. (Disruptiveadvertising)
- 76% of people who search for something nearby on a smartphone will visit a business within one day. (Disruptiveadvertising)
- $1.16 is the lowest average CPC for search on Google Ads, belonging to ecommerce. (Webfx)
- 90% of advertisers say text ads are the most important PPC channel. (Webfx)
- The top PPC search engines in order are Google, Yahoo and Bing. (Disruptiveadvertising)
- Internet users spend one-third of their time online across social media platforms like Facebook and Twitter. (Disruptiveadvertising)
- 85% of US internet users, or 242 million people, executed searches monthly in 2019. (Webfx)
- 80% is about how much search ads can increase brand awareness. (Webfx)
- 2018 to 2019, the total number of devices around the world with ad blockers rose from 142 million to upwards of 615 million. (Disruptiveadvertising)
- From 2016 to 2017, roughly 7% of people viewed pay-per-click ads poorly, meaning they associated them with negativity. From 2017 to 2018, on the other hand, only 1% of consumers held negative connotations to this type of advertisement. (Disruptiveadvertising)
- 65% of all high-intent searches result in an ad click. (Webfx)
- 45% of all online advertising revenue in the U.S. in 2018 amounted to search. (Webfx)
- 45% of page clicks are earned by Ads that appear in search results. (Webfx)
- 63% of website visits are abandoned if a mobile site takes 3 seconds to fully load or more. (Disruptiveadvertising)
- Sites that load within 5 secs vs 19 secs were observed to have 70% longer average sessions. (Disruptiveadvertising)
- 42% of all digital marketing spending is search marketing. (Webfx)
- 46% of consumers say that waiting for pages to load is what they dislike the most when browsing the mobile web. (Disruptiveadvertising)
- Mobile devices account for 53% of paid-search clicks (just one more reason to optimize your campaign for mobile advertisements). (Disruptiveadvertising)
- 46% of all clicks go to the top three pay-per-click (PPC) ads. (Webfx)
Mobile marketing statistics 2022
- 76% of people shop on their smartphone (Webfx)
- 90% of people have made a purchase on their smartphone (Webfx)
- Up to 70% of web traffic happens on a mobile device (CIODive)
- 57% of all U.S. online traffic now comes from smartphones and tablets (BrightEdge)
- More than 50% of Internet traffic comes from mobile devices (Webfx)
- About 3 in 5 consumers check their email on the go, and 75% of Americans say they use their smartphones most often to check email
- 80% of email users are expected to access their email accounts via a mobile device by the end of 2018. (Radicat)
- As a whole, in 2017, 61% of U.S. email opens occurred on mobile, 15% on desktop and 24% in a webmail client (Adestra)
- 50% of mobile searches are for local search results (Webfx)
- More than 40% of online transactions happen on mobile devices (Webfx)
- In 2017, 95.1% of active Facebook users accessed the social network via a mobile device (Statista)
- 85% of the time users spend on Twitter is on a mobile device (Wall Street Journal)
- 60% of LinkedIn traffic comes from mobile devices (Fortune)
- 52% of people are less likely to engage with a company with a bad mobile site (Webfx)
- 80% of people use Pinterest on mobile. (CoSchedule Blog)
- The most popular mobile messenger app globally as of July 2018 is WhatsApp. (Statitsa)
- 61% of consumers say they’re more likely to buy from mobile-optimized sites (Webfx)
- The average mobile session is 40 minutes (Webfx)
- Almost 9 in 10 smartphone users are not absolutely certain of the specific brand they want to buy when looking for information online. (Google)
- 75% of smartphone users expect to get immediate information while using their smartphone. (Google)
- 77% of smartphone shoppers are more likely to purchase from companies whose mobile sites or apps allow them to make purchases quickly. (Google)
- Two-thirds of consumers can recall a specific brand they have seen advertised on mobile in the last week. (Business Wire)
- 60% of consumers click on mobile ads at least weekly. (Business Wire)
- Mobile searches for “best” have grown over 80% in the past two years (Google)
- 51% of customers say that they use mobile devices to discover new brands and products (BrightEdge)
- 69% of smartphone users also say that they are more likely to buy from companies with mobile sites that easily address their questions or concerns (BrightEdge)
- Worldwide, more people own a cell phone than a toothbrush. (Consumer Technology Association)
- 54% of all mobile brand experiences are video or image-based (Google)
- 89% of people are likely to recommend a brand after a positive brand experience on Mobile (Google)
- 89% of people on smartphones are using apps, while only 11% are using standard websites. (Disruptive Advertising)
- People today have 2X more interactions with brands on mobile than anywhere else—that includes TV, in-store, you name it (Google)
- 46% of people say they would not purchase from a brand again if they had an interruptive mobile experience (Google)
- Users spend on average 69% of their media time on smartphones (Comscore)
- By 2018, American adults are expected to spend, on average, 3 hours, and 23 minutes on nonvoice mobile media. (eMarketer)
- Apps account for 89% of mobile media time, with the other 11% spent on websites. (Smart Insights)
- 80% of smartphone users are more likely to purchase from companies with mobile sites or apps that help them easily answer their questions. (Google)
- Over 51% of smartphone users have discovered a new company or product while conducting a search on their smartphone. (Google)
- Mobile can fast-track time to purchase by 20% through facilitating efficiencies in decision-making and enhanced team collaboration, particularly with more complex purchases (Google)
- Over 40% of online transactions are now done on mobile (Google)
- Mobile searches related to “same-day shipping” have grown over 120% since 2015 (Google)
- Nearly 2/3 of smartphone users are more likely to purchase from companies whose mobile sites or apps customize information to their location (Google)
- Smartphone users are 50% more likely to expect to purchase something immediately while using their smartphone compared to a year ago (Google)
- 91% of smartphone owners purchased or planned to purchase something after seeing an ad they described as relevant (Google)
- When people have a negative brand experience on mobile, they are 62% less likely to purchase from that brand in the future than if they had a positive experience (Google)
- 70% of smartphone users who bought something in a store first turned to their phone for information about a purchase (Google)
- 35% of people who searched on their phone spent more than they expected in the store (Google)
Content marketing statistics 2022
- Content marketing costs 62% less than traditional marketing (Webfx)
- Content marketing generates 3x more leads than traditional marketing (Webfx)
- 90% of all marketers use content marketing to generate inbound leads. (Gist)
- 88% of B2B marketers use content marketing (Webfx)
- Businesses that use content marketing get 6x more conversions than businesses that don’t (Webfx)
- 73% of major organizations hire someone specifically to manage content marketing (Webfx)
- Only 42% of B2B marketers say they’re effective at content marketing (Webfx)
- A 2020 Ziflow survey found that the main priority for 55% of marketing agencies was to increase creative output and project bandwidth. (Ziflow)
- Revisions also account for delays — 52% of marketing teams said an asset is revised between three and five times before it is considered final. 20% of teams reported five to 10 revisions for assets. (Ziflow)
- 70% of marketers are actively investing in content marketing. (HubSpot)
- 78% of companies have a team of one-to-three content specialists. (SEMrush)
- Web traffic is among the top two most-common measurements of success for content marketing strategies. (HubSpot)
- The most common measurement of success for content marketing programs is Total Sales. (HubSpot)
- 24% of marketers plan on increasing their investment in content marketing in 2020. (HubSpot)
- Marketers today create content for multiple audience segments — marketing to three audience segments is most common. (HubSpot)
- Nearly 40% of marketers say content marketing is a very important part of their overall marketing strategy. (HubSpot)
- “Content Marketing Strategy” is the most searched query related to content marketing. (SEMrush)
- 77% of companies say they have a content marketing strategy. (SEMrush)
- 94% of marketers use social media for content distribution. (SEMrush)
- 54% of marketing leaders attributed creative production delays to having more projects than their team could handle. (Ziflow)
- 60% of marketers create at least one piece of new content daily (Webfx)
- Content marketing leaders experience 7.8x higher annual growth (19.7%) than their followers (2.5%) (Webfx)
- 78% of CMOs believe custom content is the future of marketing in general (Webfx)
- For as much as 71% of B2B industry professionals, purchasing decisions are influenced by reading a corporate blog at some point. (LinkedIn)
- 89% of content marketers used blog posts in their content creation strategy in 2020. (MarketingProfs)
- 39% of marketing spend goes to content marketing, according to B2B marketers (Webfx)
- 48% of small organizations have documented content marketing strategies (Webfx)
- 41% of large organizations have documented content marketing strategies (Webfx)
- The COVID-19 pandemic has created a lot more work for creative content teams. Over 50% of surveyed marketing leaders said they were busier than ever following the COVID-19 crisis in March 2020. (Ziflow)
- 58% of marketers say original written content is more important than other formats (Webfx)
- On average, B2B marketers use 13 content marketing strategies (Webfx)
- 72% of marketers believe branded content is more effective than magazine advertising (Webfx)
- 69% of marketers say content is better than direct mail and public relations (Webfx)
- 56% of Businesses Reported that They Plan to Increase Content Creation Spending (siege Media)
- 60% of marketers reuse content between 2-5 times (Webfx)
- 64% of B2B marketers outsource writing (Webfx)
- 72% of marketers produce “significantly more” content than they did last year (Webfx)
- Companies that invest in Google Ads on average see double their investment in earnings. (Google)
- 82% of marketers who regularly blog see positive ROI from inbound marketing in general (Webfx)
- 76% of B2B marketers blog (Webfx)
- 81% of marketers plan to increase original written content (Webfx)
- In marketing, infographic usage grew from 9% to 52% (Webfx)
- Infographic demand has grown 800% in one year (Webfx)
- Content marketing creates three times as many leads as traditional marketing and costs 64% less. (Showpad)
- 28% of marketers want to learn more about podcasting (Webfx)
- 44% of marketers say content production is their biggest challenge (Webfx)
- 44% of B2B organizations have seen their sales cycles increase in the past year, and yet marketers continue to feel pressure to provide concrete proof of ROI. (LinkedIn)
- 92% of B2B marketers now have an ABM program, and 68% of them use automation. (Martech)
- Only 10% of marketers use gamification to reach customers (Webfx)
- 79% of marketers reported “generating more quality leads” to be their top content priority in 2021. (Semrush)
- Content with visuals gets 94% more views than text-only content (Webfx)
- Videos improve conversions by 86% (Webfx)
- 55% of marketers say they’ll prioritize visual content (Webfx)
- 95% of B2B customers view content as a marker of trust when evaluating a business. (Ziflow)
- In 2020, 86% of B2B companies outsourced content creation, and 30% outsourced content distribution. (Ziflow)
- 89% of marketers point out that brand awareness is a goal when creating content. (Contently)
Video marketing statistics 2022
- 63% of businesses use video for marketing (Webfx)
- Videos improve conversions by 86% (Webfx)
- 80% of people switch between online search and video when researching a purchase (Webfx)
- Over 100 million people watch YouTube TV on their TV screens each month in the U.S. (Think with Google)
- There has been an 800% increase in global watch time of ad-supported and purchased feature-length movies in the past year. (Think with Google)
- 90% of users say video helps them make a purchase decision (Webfx)
- 50% of small businesses report video as their most effective content type for marketing. (Service Direct)
- Video has become the most commonly used format in content marketing, overtaking blogs and infographics. (HubSpot)
- Promotional videos and brand storytelling are the most common video types created by marketers. (HubSpot)
- 87% of video marketers say that video has increased traffic to their website. (Wyzowl)
- 80% of video marketers claim that video has directly increased sales. (Wyzowl)
- YouTube has over 2 billion active monthly users. (YouTube)
- YouTube streams over 1 billion hours of video a day. (YouTube)
- More than 65% of YouTube viewers say video content on the platform feels like real life. (Think with Google)
- Over 55% of shoppers used online video when shopping in store (Webfx)
- Mobile video consumption rises by 100% every year. (Insivia)
- 73% of consumers want to see videos on social media that are “entertaining.” (HubSpot)
- 54% of people want marketers to produce more video content. (HubSpot)
- 86% of videos related to business content are viewed on desktops while mobile phones show 14%. (HubSpot)
- People spend 88% more time on pages with video (Webfx)
- More than 70% of watch time on YouTube comes from mobile devices. (YouTube)
- People are 1.5 times more likely to turn to mobile phones to watch a video. (Facebook)
- Video is expected to make up 82% of all internet traffic by 2021. (Cisco
- 92% of people share videos with others (Webfx)
- 83% of marketers that use video believes it delivers a good ROI (Webfx)
- Facebook gets over 8 billion video views per day. (TechCrunch)
- Twitter receives over 2 billion video views per day. (Twitter)
- Snapchat users watch over 10 billion videos a day. (Mashable)
- As much as 62% of people agreed to being more interested in a product after seeing it in a Facebook Story. (Marketing Land)
- As much as 45% of Twitter users want more videos from celebrities. (Twitter)
- 75 million people access Facebook’s video platform every day. (Adweek)
- Facebook video promotions are now as popular as photo promotions. (Socialbakers)
- As many as 70% of millennials prefer to use their phones in portrait view when watching videos on mobile. (AdNews)
- 90% of Twitter video views are experienced on a mobile device. (Twitter)
- Social media video generates as much as 1200% more shares than text and image content combined. (G2 Crowd)
- The best length for LinkedIn videos is 30 to 90 seconds. (LinkedIn)
- 49% of consumers have watched at least one video on Instagram TV. (Animoto)
- 81% of businesses choose Facebook for their video marketing. (Buffer)
- 60% of Instagram Stories videos are watched with the sound on. (Instagram)
- Video marketing campaigns on LinkedIn can generate view rates as high as 50%. (LinkedIn)
- 46% of consumers watch more video ads on social media platforms than on TV. (Animoto)
- Video is shared 20 times more often than any other content formats in the LinkedIn feeds. (LinkedIn)
- 85% of Facebook videos are watched without sound. (Instagram)
- As many as 57% of millennial consumers watch more video ads on social media than on television stations. (Animoto)
- Video campaigns are generating view rates as high as 50%. (LinkedIn)
- On average, businesses publish 18 videos each month (HubSpot)
- Of first-time video marketers, 48% decided to commit to video because they found it easier to persuade colleagues of its value. (Wyzowl)
- Attention spans are shortening leaving marketers with 2.7 seconds to capture audiences. (MarketingMag)
- As much as 35% of businesses are using intermediate or advanced analytics to measure the performance of videos. (HubSpot)
- Millennial internet users are more likely to watch television shows on Netflix and YouTube than turn to a television network. (ThinkNow Research)
- Personalized videos are 35% more likely to retain viewers than non-personalized video. (HubSpot)
Email marketing statistics 2022
- For every $1 spent, email marketing generates $36 in ROI (Ecommerce Platforms)
- 89% of marketers say email is their primary lead generation strategy (Webfx)
- Up to 60% of email opens are on mobile, depending on the industry. (Campaign Monitor)
- 75% of Gmail users are using their mobile devices to access their email. (Backlinko)
- 42.3% of consumers will delete an email if it isn’t optimized for mobile. (Backlinko)
- 41% of marketers rely on email marketing analytics for performance data (Webfx)
- The top 20% of email marketing companies earn an ROI of 70-1 or more (Webfx)
- Email list segmentation increases CTR by 5% (Webfx)
- For every $1 spent, email marketing generates $36 in ROI. (Ecommerce-Platforms)
- Conversion rates for emails are higher than social media, direct traffic, and search. (Smart Insights)
- 81% of businesses say that email drives customer acquisition, and 80% for retention. (Emarsys)
- 33% of all emails are opened on iPhones (Webfx)
- 61% of consumers enjoy weekly promotional emails (Webfx)
- 32% of companies report an increase in revenue within one year of using marketing automation (Webfx)
- Personalized subject lines increase email opens by 41.8% (Webfx)
- 82% of all companies use email marketing (Webfx)
- Email is 40x more effective at getting customers than Facebook or Twitter (Webfx)
- 59% of marketers cite email as their number one source of ROI. (Emma)
- Email offers result in shoppers spending 138% on their purchases. (Disruptive Advertising)
- 99% of consumers use email every single day. (HubSpot)
- Personalized emails can produce a transaction rate of 6x higher than those of other marketing emails. (Business2Community)
- Marketers who segment their email marketing campaigns noted as much as a 760% increase in revenue. (HubSpot)
- 60% of consumers prefer signing up for a brand’s email list for promotional offers compared to 20% who follow brands on social for deals. (OptinMonster)
- 59% of consumers say that email marketing influences their purchasing decisions. (HubSpot)
- Only 14% of subscribers believe that the majority of the marketing emails they receive are relevant to them. (OptinMonster)
- 58% of consumers check their email before doing anything else online. (OptinMonster)
- In North America, the average email open rate is 19%. (GetResponse)
- Personalized subject lines provide a 26% boost in open rates. (Campaign Monitor)
- 56% of brands see higher open rates when they use emojis in their subject lines. (Disruptive Advertising)
- 47% of recipients open emails based on subject lines alone. (OptinMonster)
- The best day for the highest open rates is Tuesday (CampaignMonitor)
- The best time for sending emails is 10 in the morning. (Coschedule)
- In 2020, an average of 306.4 billion emails were sent and received per day. (Adobe)
- 89% of marketers use email as the primary channel for generating leads. (Adobe)
- The average click-through rate was 2.6%. (Adobe)
- The average unsubscribe rate for 2020 was 0.1%. (Adobe)
- The spam rate average in 2019 was 0.02%. (Adobe)
- In 2020, the average open rate was 18%. (Adobe)
- Meanwhile, the average click-to-open rate was 14.1%. (Adobe)
- The average bounce rate was 0.7%. (Adobe)
- On average, a good response rate to aim for is 10%. (Adobe)
- 86% of professionals give priority to email connection. (Adobe)
- In Europe, North America, and APAC, email marketing is the most widely used technology for customer engagement – 77.6% (compared to 62% produced by content management and 61% shown by social media). (Adobe)
- 29% of marketers rate email marketing as the most effective marketing channel (25% for social media, 22% for SEO, and 25% for content marketing). (Adobe)
- 93% of B2B marketers use email channel for distributing content.
- 72% of customers prefer email as their main channel for business communication. (Adobe)
Social media marketing statistics 2022
- 7 in 10 Americans use social media (Webfx)
- In 2019, Snapchat was the most important social network for 44% of U.S. teens. (Statista)
- As of Q1 2020, Snapchat had 229 million daily active users globally, up from 190 million in Q1 2019. (Statista)
- 3.48 billion people use social media (Webfx)
- As of Q1 2020, 420 billion people are active on social media. (Statista)
- In 2019, 90.4% of Millennials, 77.5% of Generation X, and 48.2% of Baby Boomers were active social media users. (eMarketer)
- 54% of social browsers use social media to research products. (GlobalWebIndex)
- 87% of marketers use social media, the most common form of content marketing promotion (Webfx)
- 91% of B2B marketers distribute content through LinkedIn (Webfx)
- 73% of B2B marketers distribute content through YouTube (Webfx)
- 20% more B2C marketers used LinkedIn this year than last year (Webfx)
- Each person spends an average of 2 hours and 25 minutes on social networks and messaging. (GlobalWebIndex)
- 1.3 million new users joined social media every day in 2020. (Hootsuite)
- Millennials are logged on to social media for an average of two hours and 38 minutes daily, while Gen Z logs on for two hours and 55 minutes . (World Economic Forum)
- 74% of people use social media when making purchasing decisions (Webfx)
- 90% of young adults (18-29) use social media (Webfx)
- Facebook usage among teens is dropping gradually. While 71% of teens claimed to use the platform in 2015, the number has now dropped to 67%. (GlobalWebIndex)
- 69% of U.S. adults use Facebook and 76% have visited the platform in the last month. (Pew Research Center, GlobalWebIndex)
- Facebook had 1.84 billion daily active users in December 2020. (PR Newswire)
- 98.3% of Facebook users access the platform on mobile devices. (Statista)
- Videos drive the most ad clicks on Facebook. (DataBox)
- Facebook ads are used by 70% of marketers, and there were 9 million active advertisers on the platform in Q2 2020. ( Social Media Examiner , Statista)
- 16% of all Facebook profiles are fake or duplicates. (Statista)
- The most important social networks to teens and young adults are Instagram (32%), Twitter (24%), Facebook (14%), Snapchat (13%), and Tumblr (4%) (Webfx)
- Twitter had more than 330 million monthly active users in Q1 of 2019. (Twitter)
- The platform reached almost 200 million monetizable daily active users in Q3 of 2020, up 29% YoY. (Twitter)
- Twitter’s 2020 Q3 revenue was $936 million. (Twitter)
- In 2019, 22% of U.S. adults used Twitter, down from 24% in 2018. (Statista)
- Link clicks account for 92% of all user interaction with tweets. (HubSpot)
- 92% of all Twitter interactions are link clicks (Webfx)
- 90% of Instagram users are younger than 35 (Webfx)
- In late 2019, Instagram Stories had 500 million monthly active users. (Statista)
- 67% of Gen Z and 57% of Millennials use the platform, in comparison to only 38% of Gen X. (GlobalWebIndex)
- As of January 2021, Pinterest has 459 million global active users every month. (Pinterest)
- The number of Pinterest users in the U.S. is expected to reach 90.1 million. (Statista)
- During a survey, 25% of responding social media marketers at B2B companies stated they used Pinterest to market their businesses. (Statista)
- During a survey, 30% of responding social media marketers at B2C companies stated they used Pinterest to market their businesses. (Statista)
- Women make up more than 60% of Pinterest’s global audience. (Pinterest)
- 97% of top searches on Pinterest are unbranded. (Pinterest)
- 64% of Instagram users are under the age of 34. (Statista)
- More than 50% of YouTube views come from mobile devices (Webfx)
- LinkedIn has more than 722 million active users in 200 countries and regions worldwide. (LinkedIn)
- In Q4 of 2020, LinkedIn sessions increased 27% YoY, expected to reach 31% in Q1 2021. (Business of Apps)
- In Q1 of 2021, LinkedIn revenue is up 16% in YoY growth. (LinkedIn)
- LinkedIn made more than 8.1 billion in revenue in 2020, a 20% increase from 2019. (Business of Apps)
- Marketing Solutions is LinkedIn’s fastest-growing segment. It grew 44 percent year-over-year in Q1 of 2019. (LinkedIn)
- In 2020, LinkedIn was voted the most trusted network. (Business Insider)
- “>LinkedIn is the top paid and organic social channel for B2B businesses. (Content Marketing Institute)
- 82% of B2B markers report finding the greatest success on LinkedIn. (LinkedIn Marketing Solutions )
- Over 46% of all social media traffic to company websites comes from LinkedIn. (LinkedIn)
- The best times to post on LinkedIn are 8-10 AM and 12 PM on Wednesdays, and 9 AM and 1-2 PM on Thursdays. Sunday is the worst day for engagement. (Sprout Social)
- The average mobile session is 40 minutes (Webfx)
- YouTube is the second-largest search engine globally. (Alexa)
- YouTube is the second most popular channel for businesses sharing video content. (Buffer)
- 54% of all people want marketers to put out more video content, and this is an excellent place to begin. (Hubspot)
- In the U.S., Snapchat has an estimated 46 million monthly active users. (Statista)
- As of Q3 2019, 53% of U.S. internet users between the ages of 15 and 25 use Snapchat. (Statista)
- Snapchat offers six different advertisement formats on the platform. (Snapchat)
- In 2018, 39.9% of social network users in the U.S. used Snapchat to communicate but this share is projected to decline to 35.3% by 2023. (Statista)
- As of April 2020, the U.S. had the biggest Snapchat user base in the world, with an audience of almost 103 million users. India ranked in second place with a Snapchat audience base of 28.2 million users. (Statista)
- The majority of Snapchat visits by users are generated via mobile phones. (Statista)
- According to a survey during the Q3 2019, 48% of Snapchat users in the U.S.shared content to the social platform on a weekly basis. (Statista)
Influencer marketing statistics 2022
- 92% of people trust recommendations from other people over brands (Webfx)
- 49% of customers admit they listen to influencers.(Digital Marketing Institute)
- Between 2013 and 2016, interest in influencer marketing jumped 90x (Webfx)
- 84% of marketers use influencer marketing (Webfx)
- 81% of marketers say influencer marketing works (Webfx)
- 74% of consumers use social media to make buying decisions (Webfx)
- 87% of people admit they’ve made a purchase because an influencer prompted them to. (SocialMediaToday)
- 90% of marketers say their influencer marketing ROI is equal to or better than the ROI of their other marketing initiatives. (BigCommerce)
- For every dollar spent on influencer marketing, businesses receive $6.50. (Influencer Marketing Hub)
- 39% of marketers plan an increase in their influencer marketing budget. (TRIBE)
- Influencer marketing is expected to become a $10 billion industry by 2020. (Digital Marketing Institute)
- 99.3% of businesses use Instagram for their influencer marketing campaigns. (Influencer Marketing Hub)
- 73% of marketers say they have influencer marketing budgets (Webfx)
- Influencer marketing on Twitter increases purchasing intent by 5.2x (Webfx)
- 82% of marketers state that their company is currently advertising on Facebook (Relatable)
- 7 of 10 marketers agree that their Facebook Ads are getting increasingly expensive (Relatable)
- Instagram influencer marketing grew by nearly 40% in 2018 (Klear)
- Influencer marketing delivers 11x higher ROI than other Internet marketing (Webfx)
- 49% of people rely on recommendations from influencers when buying (Webfx)
- There are more than 558k influencers on Instagram who have more than 15k followers (Influencer DB)
- 64% of consumers said they prefer watching videos when interacting with influencer content (Rakuten)
- Facebook (89%), LinkedIn (81%), and Twitter (75%) are the three most used social media channels by B2B marketers (Blue Corona)
- Word of mouth advertising retains customers 37% better than other advertising (Webfx)
- $6.50:$1 is the average return for influencer marketing (Webfx)
- 63% of brands plan to increase their budget for influencer marketing.
- 57% of companies already have an influencer marketing programme underway (Fashion Monitor)
- 28% of companies consider influencer marketing to be the fastest-growing online customer-acquisition channel (IM Hub)
- Only 3% of the surveyed companies rated affiliate marketing as their fastest-growing channel ( IM Hub)
- 71% of marketers are aware of the FTC guidelines regarding Influencer Marketing.
- 92% of marketers who tried influencer marketing found it to be an effective channel ( Linqia)
- 72.5% of marketers think they work with the right influencers (Relatable)
- 47% of brands have a dedicated team for influencer marketing (Relatable)
- 30% of brands are running monthly Influencer Marketing campaigns (Relatable)
- The average brand budgets 32% of its influencer spend in the First Quarter ( IM Hub )
- 36% of marketers report there biggest challenge is finding suitable influencers willing to participate. (IM Hub)
- 30% would buy a product endorsed by a non-celebrity influencer ( Collective Bias.)
- Marketing induced consumer-to-consumer word of mouth generates 23% of internet visitors have already seen an influencer video with a product placement
- 14- to 29-year-old age group, 60% have already visited an influencer’s YouTube channel
- Engagement from micro-influencers is 60% higher than that of a traditional celebrity (Adweek)
- 92% of consumers trust online word-of-mouth recommendations, while only 33% of them trust online banner ads (Nielsen.)
- 61% of consumers interact with an influencer at least once a day (Rakuten)
- More than 240 established new influencer marketing-focused agencies and influencer platforms in 2019. (influencermarketinghub)
- 56% of women follow beauty influencers (Rakuten)
- 80% of consumers made a purchase recommended by an influencer by clicking on the link or image ( Rakuten)
- For 37% of consumers, authenticity is the most important thing about sponsored posts (IM Hub)
- Influencers get an average engagement rate of 5.7%, about double the engagement rate (203%) that brands were typically seeing for their own content (BI Intelligence)
- For every $1 spent on influencer marketing, businesses are making $7.65 in earned media value ( IM Hub.)
- By 2020, influencer marketing is projected to become a $10 billion industry (Media Kix)
- 78% of social influencers for brand collaborations worldwide used Instagram as their primary social media platform. (Statista)
- 16% of social influencers worldwide use blogs as their primary social media platform. (Statista)
- 4% of social influencers worldwide used YouTube as their primary social media platform. (Statista)
Account-based marketing statistics 2022
- 97% of marketers say ABM delivers a higher ROI than other marketing strategies (Webfx)
- “Revenue won” is the most common metric marketers use to track ABM. (LinkedIn)
- 87% of marketers who measure ROI say ABM outperforms every other marketing investment. (ITSMA)
- 89% of organizations able to report ROI said ABM accounts achieved a higher ROI than a non-ABM supported control group. 30% of these organizations reported ROI to be at least 21% higher. (SiriusDecisions)
- ABM Facilitates Team Collaboration, Customer Engagement
- 30% of marketers working in an account-based manner reported engaging 2x more frequently with their C-level targets. (The SiriusDecisions Command Center)
- 85% of marketers with a service-level agreement (SLA) think their marketing strategy is effective. (HubSpot)
- 82% of B2B marketers said ABM greatly improves the alignment between marketing and sales at their company. (LinkedIn)
- A company’s level of marketing and sales alignment typically shows a strong correlation with its level of ABM success. (LinkedIn)
- 90% of marketers use ABM marketing (Webfx)
- In 2017, 92 percent of participating B2B companies said ABM is “extremely important” or “very important” to their overall marketing efforts. (Sirius Decisions)
- In 2018, 18% of companies planned to start/increase account-based sales and marketing execution. ( InsideView)
- In 2019, 93% of those surveyed were either using ABM or planning to soon. Most organizations surveyed were either doing a pilot program with ABM (26%), or had fully rolled out an ABM program in the last 6 months (26%). ( Engagio & Salesforce Pardot)
- In 2019, 40% of B2B marketing teams were involved in company ABM initiatives. ( Engagio & Salesforce Pardot)
- In 2020, 61% of companies surveyed in 2020 had a full ABM program in place or were in the midst of a pilot program. Nearly a third (27%) were thinking about getting s tarted in the next 6 months. (DemandBase)
- 170% is the average value increase for annual contracts secured through ABM marketing (Webfx)
- On average, ABM budgets account for 36% of digital marketing spend and are growing 9% annually. (LinkedIn)
- 69% of ABM top performers now have a dedicated ABM leader at their organization. (TOPO)
- 7-12 people or decision-makers are involved in B2B sales (Webfx)
- 84% of marketers said ABM provided significant benefits to retaining and expanding existing relationships. (Alterra Group)
- 80% of B2B companies report that ABM increases their customer lifetime value. (TOPO)
- At organizations where sales and marketing teams are tightly aligned, customer retention rates are 36% higher. (MarketingProfs)
- 40% of B2B marketers still find it challenging to develop the right content for their target audience. (LinkedIn)
- 43% said unreliable data makes it hard to know who to target within accounts. (LinkedIn)
- 42% struggle to personalize content at scale for target accounts. (LinkedIn)
- In 2020, 91% of companies with 1,000 employers or more have a full ABM program in place (48%), are running a pilot (23%) or planned to get started in the next six months (20%). (DemandBase)
- 7% reported a decrease in dedicatedheadcount, showing that ABM is going mainstream. (Forrester)
- 94% of respondents said they see ABM co-existing alongside their other marketing approaches.(Forrester)
- The average percentage of marketing budget dedicated to ABM was set to increase in 2019 (from 21% to 29%). ( Engagio & Salesforce Pardot)
- Budgets dedicated to ABM have increased year-on-year by 40%, from 20% in 2019 to 28% in 2020. (DemandBase)
- For those with full ABM programs in place, it now makes up 39% of the total budget in 2020 (up from 33% in 2019). In less mature companies it made up 22% of their budget in 2020( DemandBase)
- 87% of companies say that ABM delivers higher ROI than all other types of marketing. ( ITSMA)
- Of companies with full ABM programs in place that measure ROI (54%), the vast majority report a positive ROI from their efforts. 63% report at least a 25% ROI and 46% report at least a 50% return. 5.7% even report a 2x and 6.2% report a 3x return. ( DemandBase)
- 60% of companies that use ABM saw a revenue increase of at least 10% within 12 months, while 1 in 5 companies experienced a revenue increase of 30% or more. ( Demand Gen & LeadData)
- Companies that have implemented ABM have seen a lift in average annual contract value of 171%. (ABM Leadership Alliance : State Of The Market 2017)
- 91% of respondents say deal size is larger for ABM accounts, 1 in 4 (25%) say it is over 50% larger. (Sirius Decisions: The State of the Account-Based Revenue Engine 2019)
- B2B marketers saw an increase in average annual contract value of 171% after implementing their ABM strategy. (ABM Leadership Alliance : State Of The Market)
- A total of 95% of marketing influencers say an account-based marketing strategy is successful at achieving the top priorities, with 40% describing their ABM strategy success as best-in-class. (Ascend2)
- A global survey of over 300 B2B marketers in 2019 found that those who had already delivered a return on investment (41%) did so within an average of just 9.8 months. (B2B Marketing December 2019 survey report: Become an ABM champion: How to set and smash your targets)
- Sixty-two percent say they can measure a positive impact since adopting ABM. (Forrester)
- Tighter alignment between marketing and sales is the No. 1 value that marketers can demonstrate from ABM today. (Forrester)
- 53% of marketers reveal they haven’t started to measure ABM yet. (Engagio & Salesforce Pardot)
- 54% of marketers cite “influence pipeline” as their primary ABM metric. ( Demand Gen & LeadData: )
- 60% of marketers place their focus on customers, while 32% said their focus is on prospects. The remaining 8% focus on partners. (ABM Leadership Alliance : State Of The Market)
- In 2017, 28% of marketers cited driving pipeline as their key measure — more than any other metric. (ABM Leadership Alliance : State Of The Market)
- In companies with a strong ROI from ABM; 75% measure pipeline generated and revenue, 67.5% measure meetings set and target account pipeline and 63% measure marketing qualified leads.(DemandBase)
Native advertising statistics 2022
- In four of six study groups, most participants couldn’t discern native advertising from real articles (Webfx)
- Native ad headlines generate 308x more customer attention than images or banners (Webfx)
- 63% of all mobile display ads will be native ads by 2020 (Webfx)
- US native ad spend is expected to increase by 21% in 2021 to a value of $57 billion. (eMarketer)
- Native spend on mobile more than doubled between 2018 and 2020, reaching $45 billion in the US. (eMarketer)
- The native advertising sector is predicted to grow to $400 billion by 2025. (The Drum)
- Native advertising is the second-best top-performing channel for video campaigns according to US publishers. (eMarketer)
- Native advertising on the open web that uses a softer trust-based approach to content marketing got 5-10x higher average CTRs than a more aggressive push marketing approach. (Outbrain/Content Marketing Institute)
- Native ads are 62% easier to understand than display ads, and 31% easier to understand than social ads. (Outbrain/Lumen)
- Ads shown on premium news sites are 44% more likely to be trusted than ads on social media sites. (Outbrain/Lumen)
- Native recommendations are 27% more trusted than social ads. (Outbrain/Lumen)
- 44% of viewers trust an ad viewed on a premium publisher site. (Outbrain)
- Click-to-play video is the preferred ad format, with 97% of survey respondents saying they liked it. (Outbrain)
- Long-term native campaigns are more cost-effective. Native campaigns running more than six months have a 36.4% lower average CPC than campaigns running six months or less. (Outbrain)
- The native advertising category with the highest clickthrough rate is the Beauty category, with average CTR of 0.104%. (Outbrain)
- 95% of affiliate ad content submitted to Outbrain in 2019 was accepted. (Outbrain)
- Mobile outperforms desktop on native for affiliates. Mobile-specific spend makes up half of the total affiliate spending, though it drives 65% of clicks at a 48% lower CPC. (Outbrain)
- For affiliates, utilizing Lookalikes for native advertising boosts conversions 3x and drops CPA by at least 35%. (Outbrain)
- Consumers look at native ads 53% more than display ads. (Outbrain)
- Native ads create an 18% increase in purchase intent. (Outbrain)
- Native ads get 20-60% higher engagement rates than display banner ads. (Marketing Land)
- Retention rates of native advertising are 3x higher than display banner ads. (Marketing Land)
- By 2020, native in-stream ads are predicted to make up 63.2 percent of all mobile display advertising, with a value of $53 billion. (Marketing Land)
- Native ad formats have been shown to reach CTRs of approximately 0.3%, compared to 0.12% for standard IAB ad formats. (IAB Europe)
- Native ads earn 53% more views than traditional banner ads (Webfx)
- Native ads generate 53% higher purchase intent than traditional ads (Webfx)
- Only 5% of native ads actually say “ad” (Webfx)
- In 2019, US advertisers have spent around $44 billion on native ads.(searchenginejournal)
- 70% of the people would like to know about the products from the content of the article rather than traditional ad methods. (mdgadvertising)
- The Click-through rate of native ads is 40 times more than classic display ads.(ignitevisibility)
- Native ads have 53% more views when compared to traditional advertising. (searchenginejournal)
- Almost 77% of the people did not interpret native ads as advertising.(fastcompany)
- Some people around 44% couldn’t identify the sponsor of the ad they read.(contently)
- 43% of the respondents will lose trust when a trusted publisher features native ads for untrustworthy brands. (visme)
- Conversely, 41% of the respondents will gain trust when a trusted publisher features a trustworthy brand. (contently)
- In a survey, 54 percent of the respondents have said that they felt deceived in the past by clicking on the ad. (business2community)
- 25% of the market will be moved to native advertising in the coming years.(nativeadvertising)
- The global analysis revealed that Native advertising spend is expected to rise by 372% from 2020 to 2025. (prnewswire)
- In 2020, North America has the highest market with investments of $31.7 billion in the world. (deepnativeadvertising)
- Considering the rise of revenue diversification, native display ad spend will grow to $52.75 billion by the end of 2020.(emarketer)
- According to eMarketer, it is interesting to know that the share of native ads on social media has declined from 76.6% in 2018 to 73.5% in 2020.(emarketer)
- By 2021, Native advertising revenue will increase by 46%. (contentinsights)
- Retargeting ads get 76% more clicks when compared to regular display ads.(smartyads)
- 90% of the young audience of the internet are from GenZ, Millennials, and GenX (appsamurai)
- 18% More Purchase Intent With Native Ads (Taboola)
- 74% Ads Revenue from Native Ads(appsamurai)
- 53% More Attention With Native Ads(appsamurai)
- 86% Facebook Audience Network Impressions From Native Ads (appsamurai)
- Millennials, Gen X, Gen Z Prefer Native Ads (appsamurai)
- 32% People Said They’d Share Native Ads With Others (appsamurai)
Marketing audience stats 2022
- 200 million people use ad blockers (Webfx)
- People spend an average of 37 seconds on an article (Webfx)
- 96% of consumers think the ad industry doesn’t act with integrity (Webfx)
- 73% of Millennials say it’s their responsibility to help loved ones make smart purchases (Webfx)
- Teens are 7x more interested in and attached to YouTube stars than traditional celebrities (Webfx)
- The average Internet user spends 28% of their time on social media (Webfx)
- Generating quality leads is the main goal of 79% of marketers in 2021 (eMarketer)
- 46% of B2B marketers planned to increase their marketing spend in 2020 vs the previous year, 12% of those by more than 9%. (Statista)
- 96% of the most successful content marketers say that content marketing has helped them build credibility and trust with their audience (CMI)
- 95% of the B2B service and product buyers admit that they view content as a trustworthy marker when evaluating a business (Demand Gen Report)
- 87% of marketers believe that content marketing helped meet their brand awareness goals in 2020. (Statista)
- Design and visual content is the biggest challenge for 23.7% of content marketers. (HubSpot)
- User-generated content on Facebook affected up to 26.4% of purchase decisions vs 1.9% for Twitter in 2020 (eMarketer)
- Video is the #1 form of media used in content strategy, overtaking blogs and infographics. (HubSpot)
- In 2020, US adults spent 7 hours 50 minutes consuming digital media per day, up 15% (59 minutes) over the average daily time spent in 2019. (Marketing Charts)
- Most marketers measure success with content marketing through sales numbers. (Hubspot)
- 70% of marketers are actively investing in content marketing. (HubSpot)
- 75% of B2C marketers think their organization is successful with content marketing. (Marketing Profs)
- 189 million Facebook users (18%) only use it on mobile (Webfx)
- 84% of social media users follow brands (Webfx)
- 63% of all Internet users regularly watch YouTube (Webfx)
- 89% of Millennials trust friend or family recommendations more than brand claims (Webfx)
- 44% of Millennials are willing to promote products through social media for rewards (Webfx)
- The COVID-19 crisis has largely created more work and communication for creative teams. Over 50% of surveyed marketing leaders said they were busier than ever following the COVID-19 crisis in March 2020. (Ziflow Creative Production Benchmark Survey)
- 54% of marketing leaders said their biggest cause of delays in creative production is due to having a bigger volume of projects/requests than their team can handle. (Ziflow Creative Production Benchmark Survey)
- 42% of marketing leaders said not getting feedback & comments from internal stakeholders in a timely fashion is the top cause of project delays. (Ziflow Creative Production Benchmark Survey)
- 52% of marketing teams go through 3-5 versions of an asset before it is considered final. 20% of teams require 5-10 versions. (Ziflow Creative Production Benchmark Survey)
- 48% of marketing agencies said that change requests that come in after a project has been approved by another stakeholder is the biggest challenge in their client review process. (Ziflow Creative Production Benchmark Survey)
- 78% of all creative work is subject to at least one type of compliance. (Ziflow)
- Spending on VR for business is expected to reach $9.2 billion by 2021, outpacing its use for leisure. (FinancesOnline)
- 56% of digital media professionals think programmatic advertising will be the most vulnerable to brand risk incidents in 2021. (eMarketer)
- Video projects have the longest average project review turn around time of any media type, taking about 65 days to complete. (internal ZIflow benchmark data analysis)
- User-generated content on Facebook influences purchasing decisions for up to 25.3% of people. (eMarketer)
- 4.48 billion people currently use social media worldwide, up more than double from 2.07 billion in 2015 (backlinko)
- The average social media user engages with an average of 6.6 various social media platforms (backlinko)
- The social media growth rate since 2015 is an average of 12.5% year-over-year. However, growth is on the decline with 2019-2020 data revealing a 9.2% growth rate (backlinko)
- By region, social media growth in 2019-2020 is led by Asia: +16.98%, Africa +13.92%, South America +8.00%, North America +6.96%, Europe +4.32%, and Australasia +4.9% (backlinko)
- 60.99% of the 7.87 billion people in the world use social media, of eligible audiences aged 13+, there is 63% that are active users (backlinko)
- 93.33% of internet users are on social media; however, a titanic 85% of mobile internet users are active on networks (backlinko)
- Out of 4.48 billion social media users, 99% access websites or apps through a mobile device, with only 1.32% accessing platforms exclusively via desktop(backlinko)
- Globally, the average time a person spends on social media a day is 2 hours 24 minutes; if someone signed up at 16 and lived to 70, they would spend 5.7 years of their life on it (backlinko)
- Facebook is the leading social network at 2.9 billion monthly active users, followed by YouTube (2.3 billion), WhatsApp (2 billion), FB Messenger (1.3 billion), and WeChat (1.2 billion) (backlinko)
- 72.3% of the total US population actively use social media, totaling a number of 240 million people (backlinko)
Miscellaneous marketing statistics
- 80% of users say online reviews have changed their minds about a purchase (Webfx)
- People are 79% less likely to buy from a website after a negative experience (Webfx)
- 63% of shoppers research before they buy a product (Webfx)
- 63% of people expect brands to use their purchase history to provide them with personalized experiences (Webfx)
- 46% of people will tell friends and family about a negative experience (Webfx)
- People are 44% more likely to develop a negative view of a company after a negative experience (Webfx)
- 10x is how much more it costs to earn a new customer than retain an existing customer (Webfx)
- Brand interactions described as “helpful” are 1.5x as likely to lead consumers to both buy from that brand and recommend that brand (Webfx)
Statistics are applied in marketing to identify market trends, and to measure and evaluate the potential and success of marketing programs. The secret to successful marketing is to identify the target market accurately and to use effective marketing communications channels and tactics to reach it. Statistics can help the marketer achieve both of those goals as well as evaluate the success of the marketing effort and provide data on which to base changes to the marketing program.